v3.1.0: Spring 2026 Release — v3.1.0
The RelayDesk Spring 2026 release is our most significant update to date. A completely rebuilt Analytics module gives you five tabs and fourteen charts of institutional-grade performance reporting. The Live Monitor gains real-time options payoff diagrams so you can see exactly where your trade stands as the underlying moves. We’ve also added sign-in with Apple and TOTP two-factor authentication to keep your account secure. Refreshed Research, Dashboard, and Signals interfaces round out a release where every screen has been touched, polished, or rebuilt.
✨New Features
New Analytics suite with 5 tabs and 14 charts
high impactThe Analytics module has been rebuilt from scratch into a five-tab performance suite. The Overview tab shows a KPI grid (P&L, win rate, profit factor, expectancy), an equity curve, and a P&L calendar. The Bots tab lets you compare bots side by side with an equity-curve overlay and a per-bot detail panel. The Risk tab tracks drawdown history and max-adverse-excursion. The Strategy tab surfaces a P&L distribution histogram, hold-time scatter plot, day-of-week and time-of-day heatmaps, and a symbol performance breakdown. The Optimization tab is new: it analyzes your historical results and surfaces specific parameter changes that would have improved performance.
Live Monitor: real-time options payoff diagrams
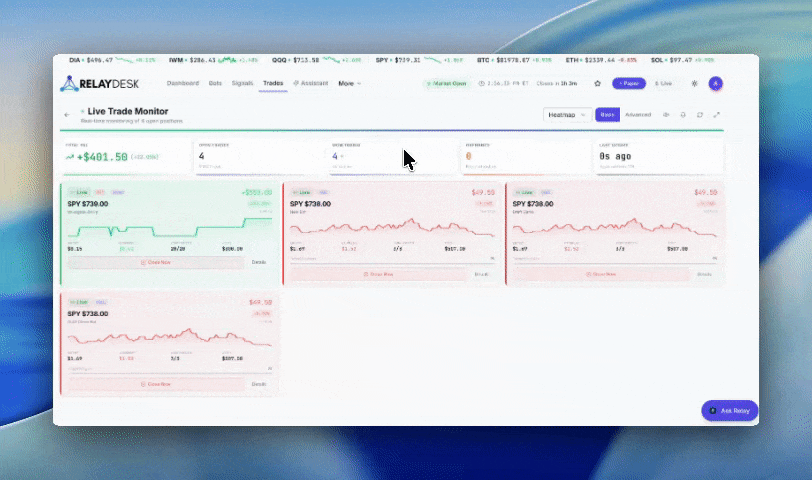
high impactThe Live Monitor now offers an Advanced view for any open trade card. It shows a real-time options payoff diagram with your break-even point, take-profit levels, and stop-loss level marked on the curve. A live dot tracks the current spot price and moves as the underlying moves, so you can see your position's P&L profile update in real time.
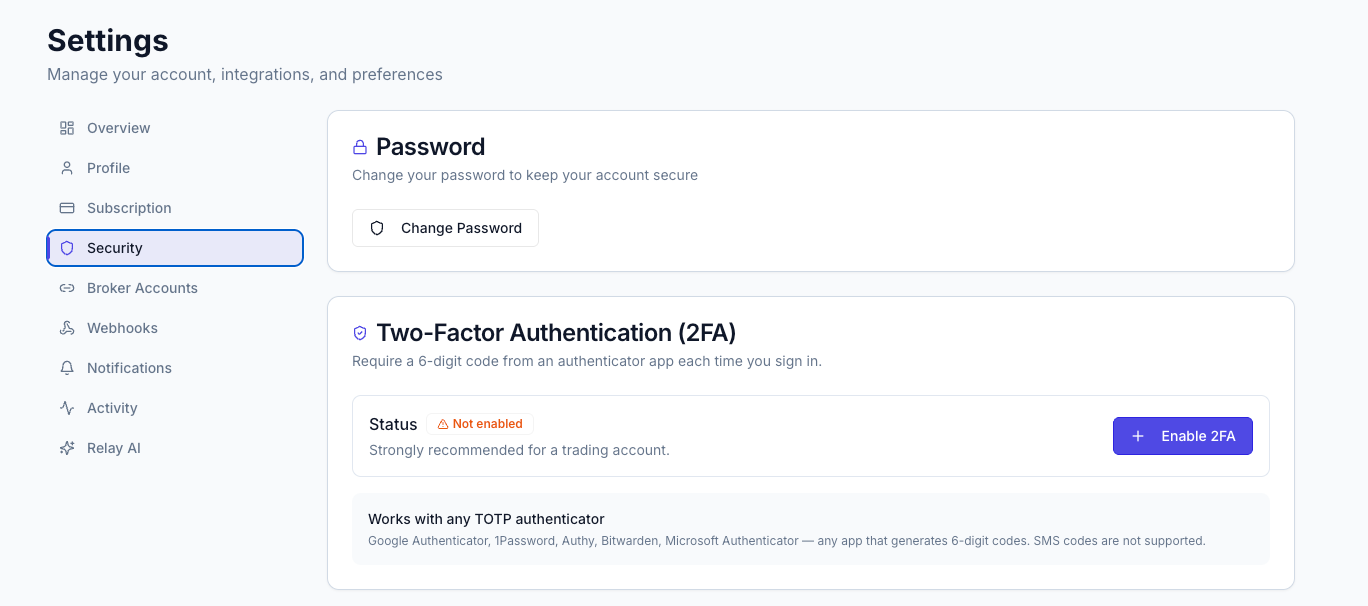
Sign in with Apple and optional TOTP two-factor authentication
high impactYou can now sign in with Apple, joining Google and email/password as sign-in options. You can also enroll an authenticator app (Google Authenticator, 1Password, Authy, or any TOTP-compatible app) via QR code in Settings. Once enrolled, you are prompted for a six-digit code at sign-in. Enrolled factors can be viewed and removed in your Security settings at any time.
🚀Improvements
- ●
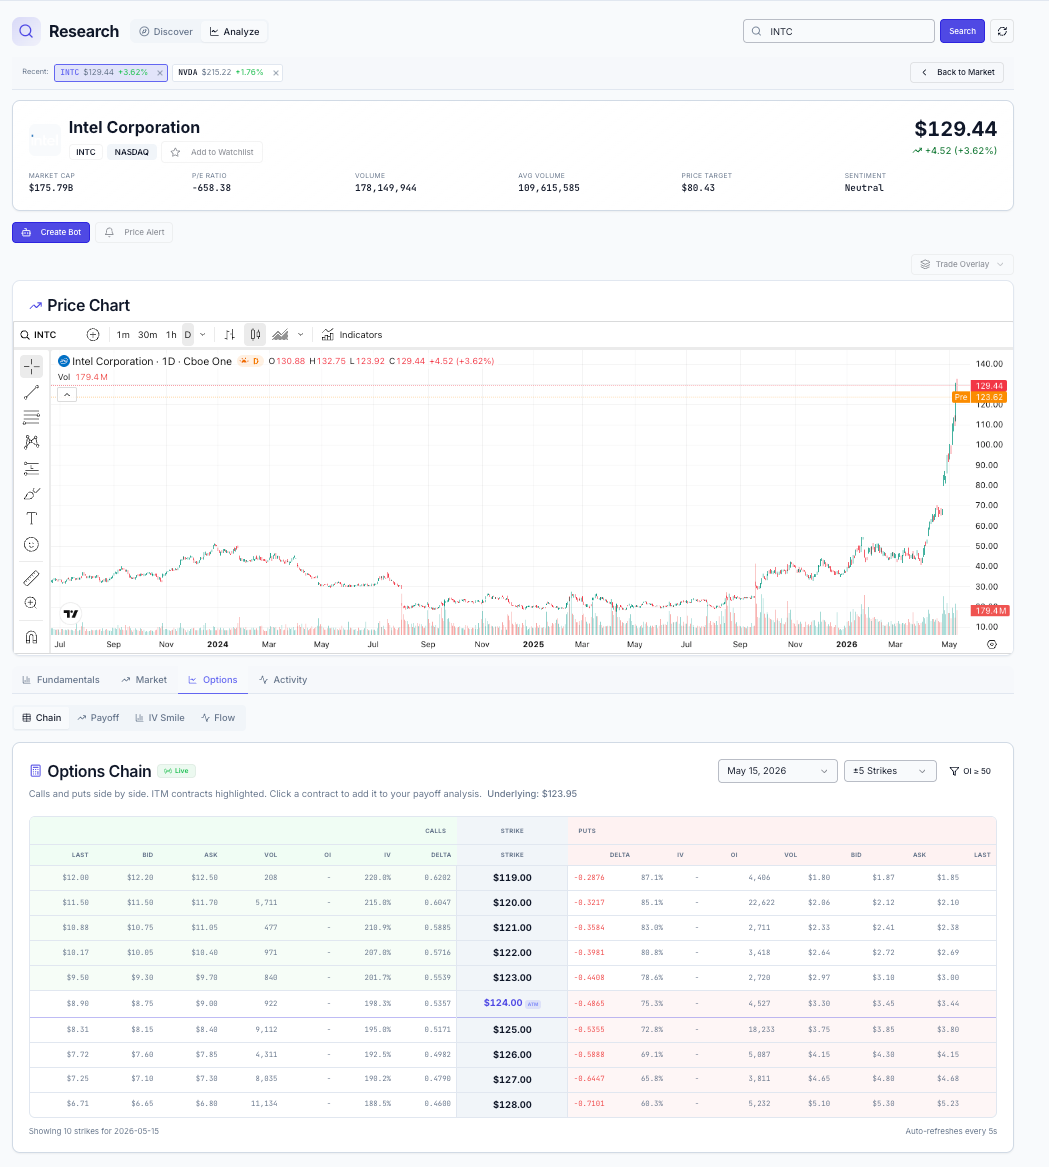
Research: Market Movers, sector heatmap, and Symbol Bar
Three new widgets now appear in the Research module. Market Movers shows gainers, losers, and most-active tickers in a sidebar. The sector heatmap gives a market-cap-weighted view of sector performance and loads faster and works better on mobile than the chart it replaced. The Symbol Bar is a strip of recently-viewed ticker chips for quick navigation between research targets. The Upcoming Events list has also been refreshed to show earnings, dividends, and economic events in one unified view.
- ●
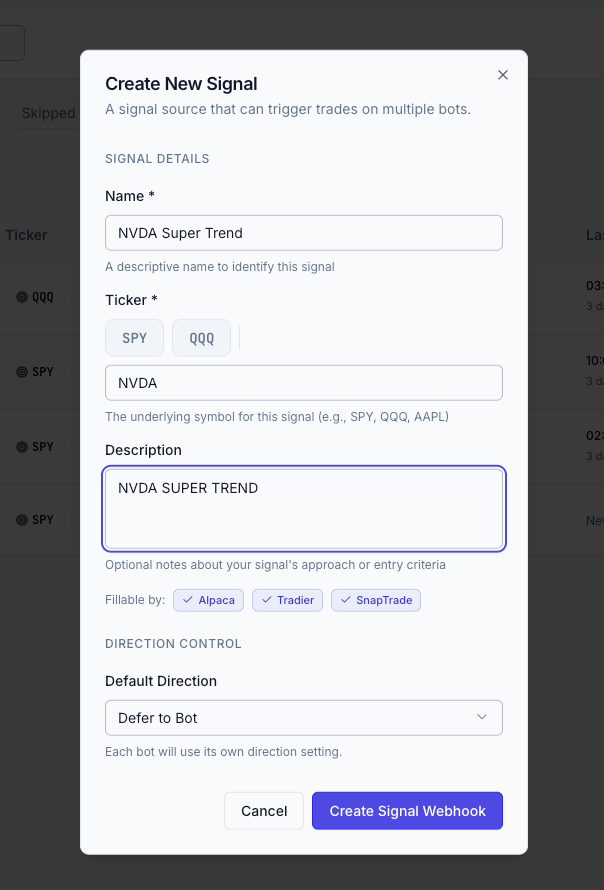
Signal creation: real-time broker compatibility feedback
When you create a new signal, the dialog now shows which of your connected brokers can fill that signal's asset class. You see broker compatibility before you save, not at execution time.
- ●
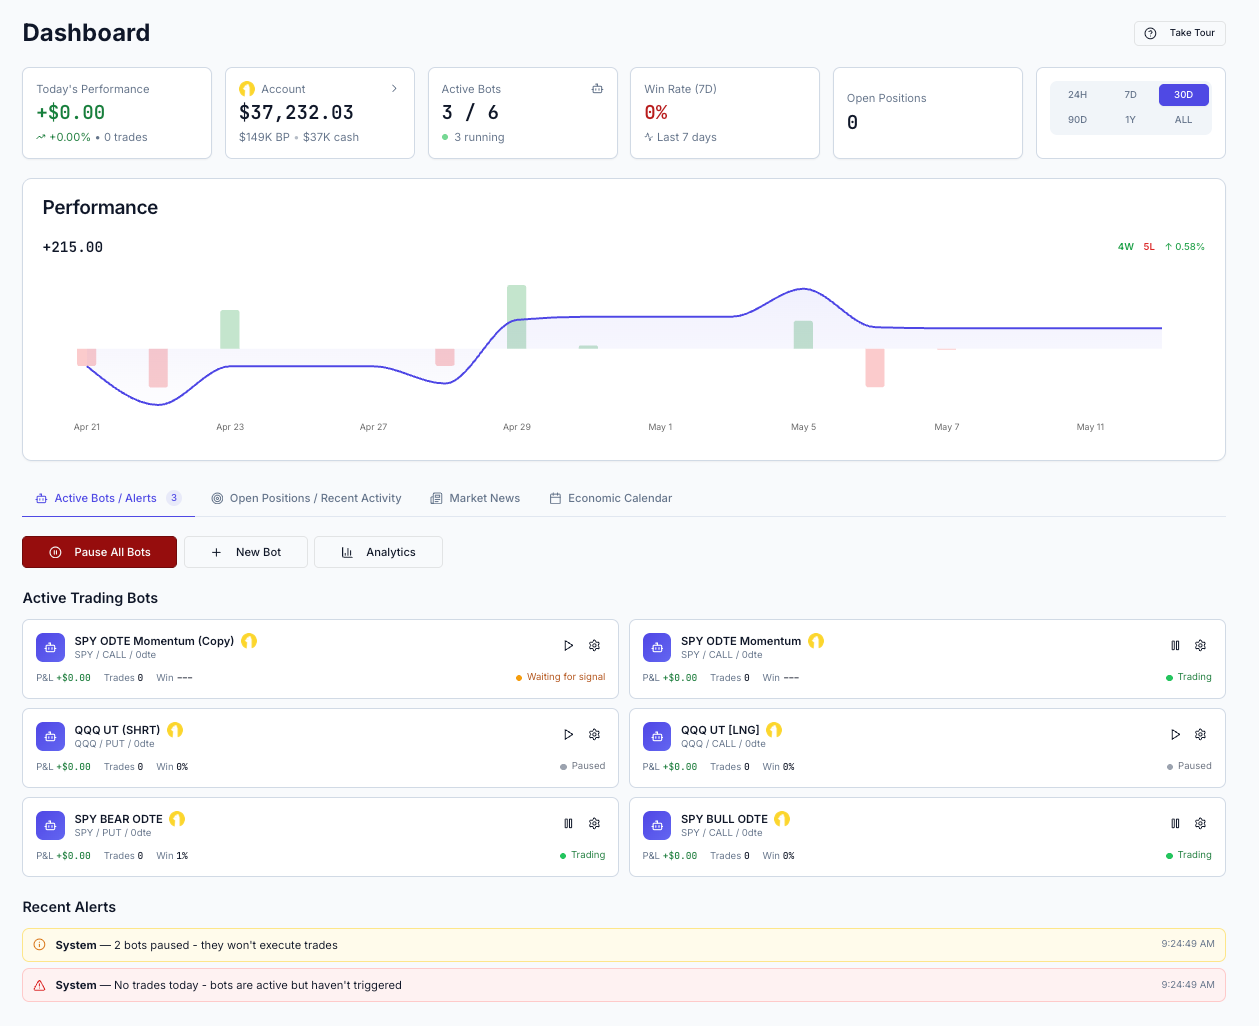
Dashboard: new bot cards, position card, and activity timeline
The Dashboard has three new tiles. Bot cards have been redesigned for faster scanning and optimized for mobile. The new Position card shows a live P&L summary of your open positions and can be expanded into a detailed view. The Activity timeline is a chronological feed of significant events on your account.
- ●
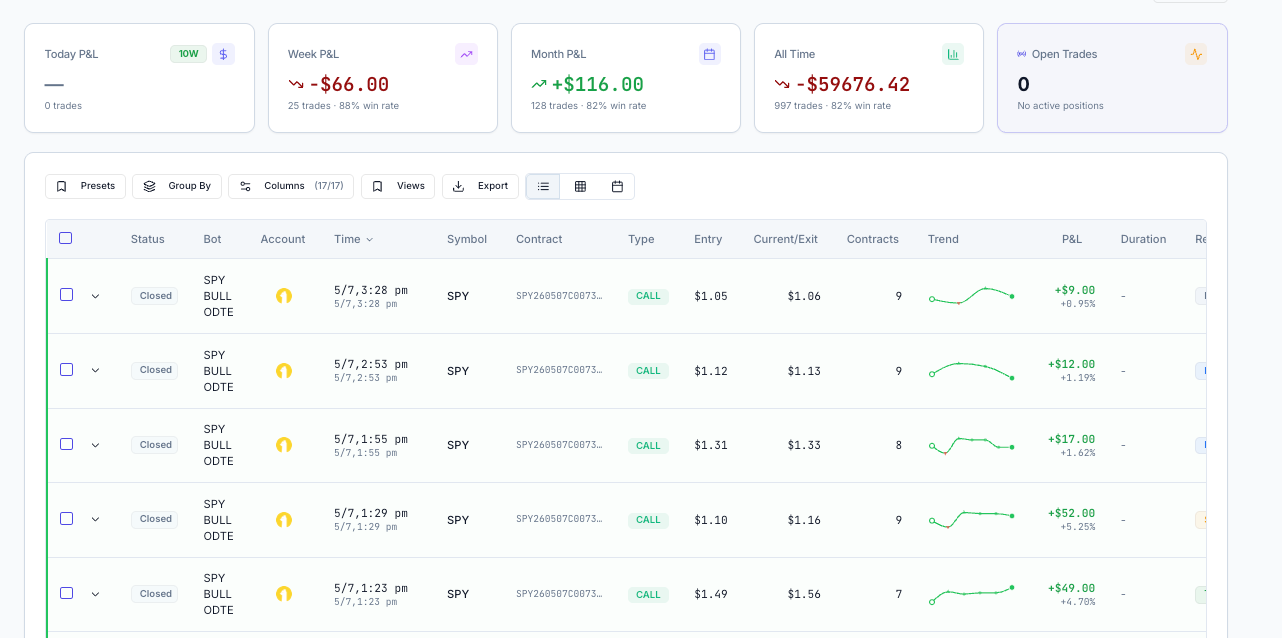
Trade History: contract column and cleaner layout
A Contract column now appears in Trade History showing the exact OCC option contract identifier for each trade. This is useful for tax reporting and trade journaling. The summary stats bar at the top of the page has moved into the Analytics suite, so Trade History now focuses on what it does best: showing your trades.
- ●
Platform-wide visual overhaul across 12+ pages
Every major page has been redesigned and refreshed. Mobile responsiveness has been improved across all surfaces and breakpoints. Pages updated include the Dashboard, Live Monitor, Trade Detail, Trade History, Settings, Login, Signup, Reset Password, Onboarding, Analytics, Relay AI, Research, Bot Builder, and Signals.
The Spring 2026 release is the biggest update in RelayDesk's history. Here is a full breakdown of everything that changed.
Analytics
New five-tab performance suite with 14 brand-new charts and widgets, built to give you the same caliber of performance reporting that portfolio managers use.
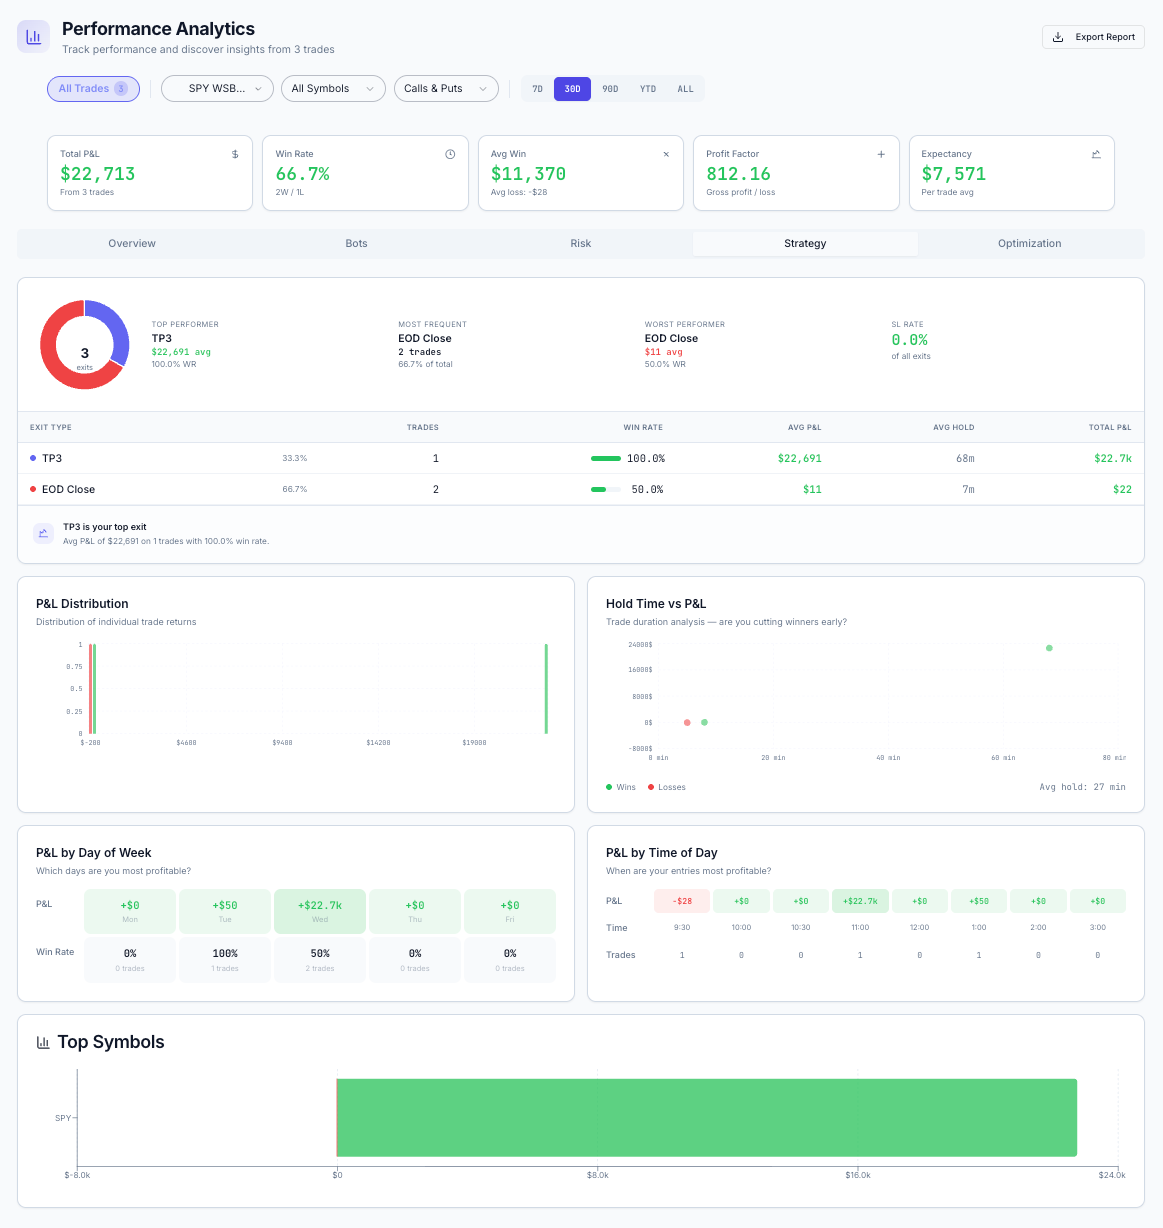
Overview tab
The Overview tab is your trading snapshot. A KPI grid surfaces your P&L, win rate, profit factor, and expectancy in one place. An insights bar highlights the most important observations from your data. Below that, an equity curve tracks your account growth over time, and a P&L calendar gives you a day-by-day view of how each session closed.
Bots tab
The Bots tab lets you compare your bots side by side. An equity-curve overlay puts multiple bots on the same chart so you can see which one is pulling ahead. A per-bot detail panel breaks down the numbers for each bot individually: win rate, P&L, profit factor, and trade count.
Risk tab
The Risk tab shows your drawdown history over time, so you can see when your account dipped, by how much, and how long recovery took. It also tracks max-adverse-excursion: how far each trade moved against you before it closed.
Strategy tab
The Strategy tab breaks down your trading patterns in four ways. A P&L distribution histogram shows where your wins and losses cluster. A hold-time scatter plot reveals whether your trade duration correlates with outcome. Day-of-week and time-of-day heatmaps show when you trade best. A symbol performance breakdown ranks your tickers by total P&L.
Optimization tab
The Optimization tab is new to this release. It analyzes your historical results and surfaces specific parameter changes that would have improved performance. Instead of just showing you what happened, it tells you what to change.
Live Monitor
Advanced View with real-time payoff diagrams
The Live Monitor now has an Advanced view for any open trade card. Open it and you see a real-time options payoff diagram with your break-even point, take-profit levels, and stop-loss level marked on the curve. A live dot tracks the current spot price and moves as the underlying moves, so you can watch your P&L profile update in real time.
You can see exactly where your option breaks even before you decide to exit, and exactly where your P&L stands relative to your targets, with the market moving in real time.
Authentication
Sign in with Apple and optional TOTP 2FA
You can now sign in with Apple, joining Google and email/password as sign-in options. If you use Google, nothing changes for you.
Optional two-factor authentication is now available for any account. Go to Settings, enroll your authenticator app (Google Authenticator, 1Password, Authy, or any TOTP-compatible app) by scanning a QR code, and from that point on you will be prompted for a six-digit code at sign-in. You can view and remove enrolled factors in your Security settings at any time.
Research
Market Movers, Sector Heatmap, and Symbol Bar
Three new widgets have been added to the Research module. Market Movers shows gainers, losers, and most-active tickers in a sidebar, useful for spotting what the market is reacting to before you pull up a chart. The sector heatmap gives you a market-cap-weighted view of sector performance at a glance. It loads faster and works better on mobile than the chart it replaced. The Symbol Bar is a strip of recently-viewed ticker chips at the top of the Research page, so you can jump back to a ticker you just looked at without retyping it.
The Upcoming Events list has also been refreshed. Earnings, dividends, and economic events now appear in one unified list rather than separate views.
Signals
Real-time Broker Compatibility Feedback
When you create a new signal, the dialog now shows which of your connected brokers can actually fill that signal's asset class. You see broker compatibility before you save the signal, not at execution time. If a broker does not support the asset class you are signaling, you know about it upfront.
Dashboard
New Bot Cards, Position card, and Activity Timeline
Three new tiles have been added to the Dashboard. Bot cards have been redesigned for faster scanning: clearer typography, better status indicators, and a layout that works on mobile. The new Position card shows a live P&L summary of your open positions and can be expanded into a full detail view without leaving the dashboard. The Activity timeline is a chronological feed of significant events on your account: trades closed, bots paused, signals received.
Trade History
Contract Column and Cleaner Layout
A Contract column has been added to Trade History, showing the exact OCC option contract identifier for each trade. This is the information tax software and trading journals ask for: strike price, expiration, call or put, all in one field per trade. The summary stats bar that used to sit at the top of the page has moved into the Analytics suite, which keeps Trade History focused on what it does best: showing your trades.
UI Overhaul
Beyond the headline features, every major page in RelayDesk has been redesigned in this release with a unified design language: brand-aligned colors, refined typography, and consistent UI patterns across the whole platform. Mobile responsiveness has been improved across all surfaces.
Pages updated include the Dashboard, Live Monitor, Trade Detail, Trade History, Settings, Login, Signup, Reset Password, Onboarding, Analytics, Relay AI, Research, Bot Builder, and Signals. If you log in and something looks different from what you remember, that is intentional.